Introduction
Have you ever noticed a web application becoming slower and less responsive the longer you use it? This is often a sign of a memory leak. Memory management is a critical aspect of software development, especially in JavaScript, where developers rely on automatic garbage collection. However, improper memory handling can lead to memory leaks, causing your application to consume more memory than necessary and eventually degrade in performance. This blog will guide you through understanding memory leaks, identifying them, and implementing fixes.
What are Memory Leaks?
A memory leak occurs when a program allocates memory but fails to release it after the memory is no longer needed. In JavaScript, this typically happens when objects that are no longer required remain referenced, preventing the garbage collector from reclaiming the memory.
What Causes Memory Leaks?
-
- Accidental Global Variables Declaring variables without let, const, or var creates unintended global variables:
// A function that creates a global variable accidentally

function createLeak() {
    leakyVariable = "I am global!"; // No 'let', 'const', or 'var' keyword makes this global
}
createLeak();
Fix: Always use let, const, or var.
-
- Uncleared Timers and Event Listeners Listeners and timers hold memory if not properly cleaned up:
// Adding an event listener to a button

let element = document.getElementById("button");
element.addEventListener("click", () => console.log("Clicked!"));
Fix: Remove listeners and clear timers:
element.removeEventListener("click", handler);
clearTimeout(timer);
-
- Detached DOM Elements Keeping references to removed DOM elements prevents garbage collection:
// A reference to a DOM element that is removed

let detached = document.getElementById("div");
document.body.removeChild(detached); // Removing the element from the DOM
Fix: Clear the reference to allow garbage collection
detached = null; // Now eligible for garbage collection
Identifying Memory Leaks
- Use Chrome DevTools
- Open DevTools and go to the Memory tab.
- Take snapshots before and after interactions to see retained memory.
- Look for memory that does not decrease over time.
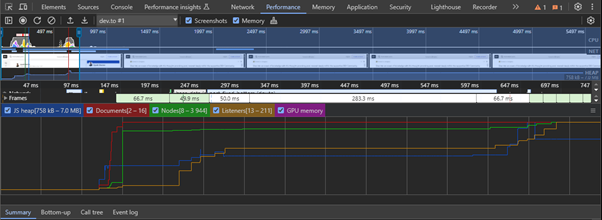
- Monitor Performance
Record memory usage using the Performance tab to detect increasing trends.
- Open Devtools
- Load the website
- Check the Memory checkbox in the performance tab and then Reload by clicking the reload icon.
![Chrome devtools performance tab]()
- Load profile and memory graphs

- Using Lighthouse
Lighthouse is a tool built into Chrome DevTools that provides automated performance audits, including memory usage. It generates a report with actionable insights to help optimize your web app’s performance and prevent memory-related issues
Fixing Memory Leaks
- Clean Up Listeners and Timers
element.removeEventListener("event", handler);
clearInterval(intervalId);
- Avoid Global Variables with strict mode:
‘use strict’;
- Detach DOM References after removal:
node = null;
Conclusion
Memory leaks in JavaScript often arise from timers, event listeners, or dangling DOM references. Use DevTools to identify leaks and clean up your code by following best practices. By keeping memory usage in check, you’ll ensure a smoother, faster user experience.
Happy coding!